Charts
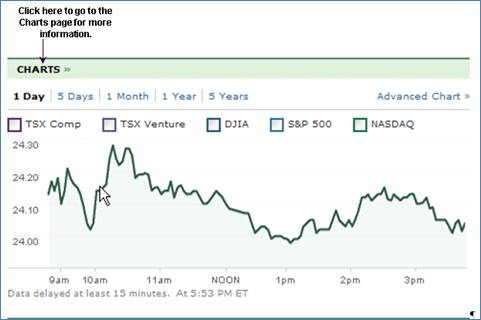
Initially, the Charts section graphs the price of the selected security over a period of time (1 day, 5 days, 1 month, 1 year, or 5 years). You can also compare the security with any or all of the following indices:
• TSX Comp
• DJIA
• S&P 500
• NASDAQ
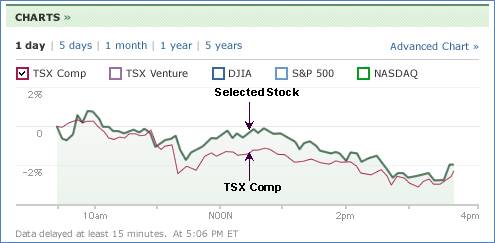
You select an index to compare the stock to by clicking in the coloured box beside the index. The colour of the box represents the colour of the index performance in the chart. To compare the stock to the TSX click the red TSX Comp check box. The chart will display TSX Comp performance to the performance of the security over a specific period of time.
For example, the following chart compares the selected stock with the TSX Comp index. When you select an index, the price chart changes to a percentage chart.
Click Advanced Chart to go to the Charts page for the selected security.