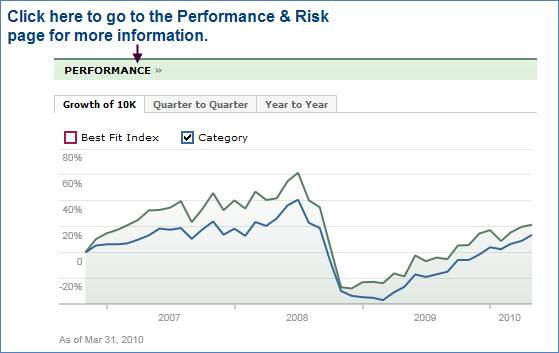
Growth of 10K

The Growth of 10K chart displays the growth of an investment of $10,000.00 in the fund over either 3 years or 5 years. You can also select whether to chart the performance of a Best Fit Index (red line) or the Category (blue line) to which the fund belongs.