Using Advanced Charting Tools
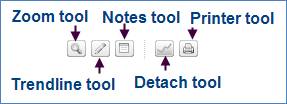
The charting toolbar contains the following chart tools:

• Zoom tool: To zoom in, press and hold down the left mouse button, move the mouse to select a zoom section and release the button to zoom in. You can use the zoom tool numerous times, depending on the range, chart period, and chart interval (a broader timeframe allows for more zooming than a narrow timeframe.) To zoom out, click on the reset link beside the zoom icon. You cannot zoom in stages nor can you save a chart or chart setting with a zoomed-in view.
• Trendline tool: You can draw up to 10 trendlines on a chart. When you have reached the maximum number of trendlines, the oldest trendline is deleted when you draw a new trendline. To draw a trendline:
1. Click on the trendline icon. The vertical cursor changes to a cross-hair indicator.
2. Press and hold down the left mouse button, move the mouse to draw the line and release the button to complete the line.
3. To move a previously drawn trendline, click on the line to select it. Using the mouse, click and drag each end of the line to the desired position.
4. To permanently delete all trendlines, click the clear link beside the Trendlines icon (while Trendlines is enabled).
• Notes tool: Enables you to add up to 20 notes to your
chart. You can only open/edit one note at a time. To view the content of any
saved note, use the mouse to scroll over the notes icon on the chart. To
hide/show all notes icons, click the Hide/Show link beside the Notes icon. To
delete all saved notes, click within the enabled Notes icon (but not on the
Hide/Show link) to display a drop-down list. Select Delete Notes to permanently
delete all saved notes.
To add a note:
1. Click the Notes icon. The vertical cursor changes to a cross-hair indicator.
1. Click the location on the chart to which the note is to be attached. The Notes window opens and displays the date to which the note is attached.
2. Enter the desired text in the Notes window (up to 256 characters).
3. Click Save to save the note or Cancel to cancel it.
• Detach tool: You can detach a chart from the main page. This helps when you are customizing multiple charts at the same time. You cannot reattach a detached chart back to the main page. To detach a chart, click the Detach tool. The chart is presented in a separate browser window.
• Print tool: Click the print tool to print a chart. Any chart customizations are captured on the printed page.