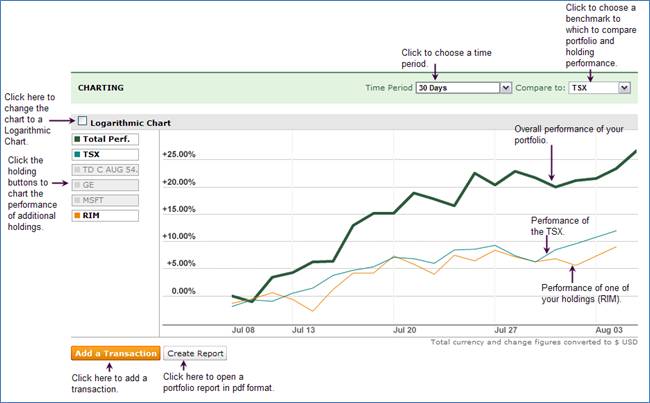
Charting Tab
This tab displays a line chart for your portfolio, showing the total performance of your portfolio over the following time periods:
• 30 Days
• 3 Months
• 6 Months
• 1 Year (the default)
• 3 Years
• 5 Years
You can compare the performance of your portfolio with any of the following indices:
• FTSE 100
• S&P 500
• DJIA
• DAX
• CAC 40
• TSX
• Hang Seng
• Nikkei
Click on one of the holding symbol buttons on the left side of the chart to add the performance of that holding to the chart. To remove that holding, click on the button again. You can chart the performance of all of your holdings at the same time.
Click the Logarithmic Chart check box to change the chart to a Logarithmic chart.