Fundamentals Tab
This tab provides information about each of your holdings grouped by asset type. Fundamental data is the qualitative and quantitative information that contributes to the economic well-being and the financial valuation of a company, security or currency.
The Fundamentals tab provides the following information about your holdings:
• Asset
• Industry
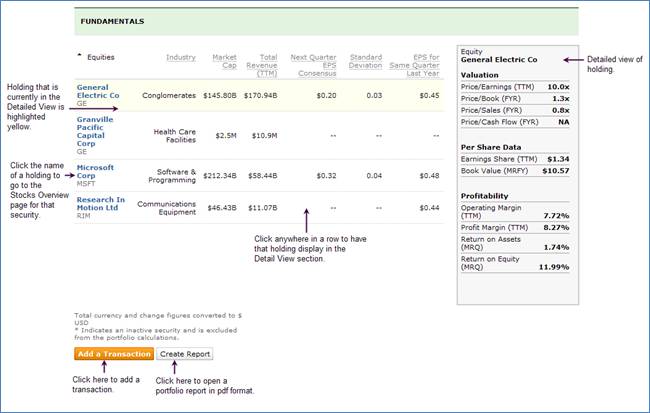
• EPS for Same Quarter Last Year
By default, the Fundamentals Table is sorted by name, but clicking on another column head (for example, Market Cap) will re-sort that section by that column. Columns are sorted in descending order (highest to lowest). If you click the column again, columns are resorted in ascending order (lowest to highest). For equities, ETFs, mutual funds, and options, you can mouse-over the holding name to display a performance chart as well as the Last Price, % change, and Volume. Click on the name of the holding to go to the Stocks Overview page for that selected security.
Click in any row of any holding to have that holding display in the detailed view section with the following information:
For ETFs, the Fundamentals Details Veiw displays the following information:
• Name
• Investment Objective
• Valuation (TTM)
• Earnings Yield
• Book Value
• Revenue Yield
• Cash Flow Yield
• Top 10 Holdings
• Holding name
• Weighting %
For Mutual Funds, the Fundamentals Details View displays the following information:
• Name
• Fund Company
• Fund Inception
• Manager
• Manager Tenure
• Management Fee
• ]Management Expense Ratio
• Investment Objective
• Load Type
Click Add a Transaction to open the Add a Transaction dialog box. See Adding a Transaction for more information.
Click Create Report to open a portfolio report in PDF format.