Gain/Loss Tab
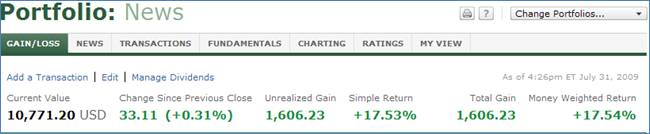
This tab provides summary information about a selected portfolio, including its
• Current value
Note: Changing the Time Period in the Gain/Loss table from the default Today, changes the values shown in the summary information. The values in the summary information will change based on the new Time Period value.
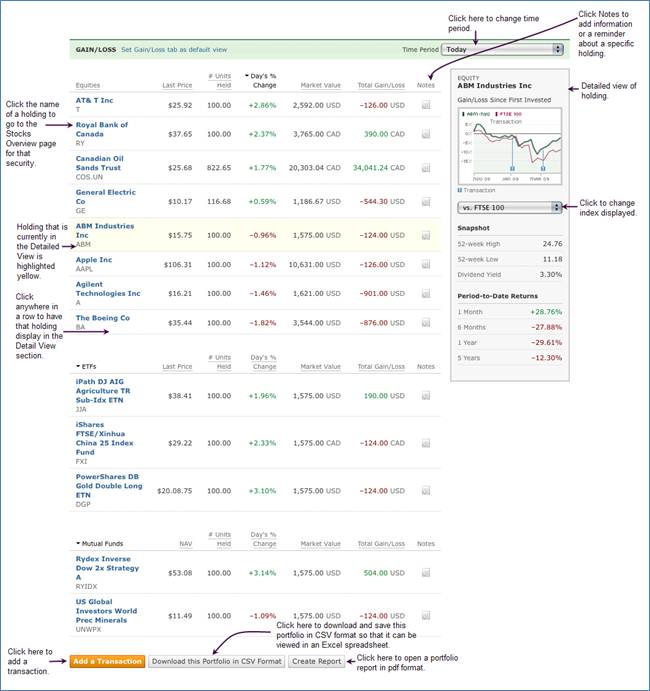
The Gain/Loss section displays performance information about all of your holdings in table format, grouped by asset type. By default, each section of the Gain/Loss table is sorted by name, but clicking on another column head (for example, Last Price) will re-sort that section by that column. Columns are sorted in descending order (highest to lowest). If you click the column again, columns are resorted in ascending order (lowest to highest). For equities, ETFs, mutual funds, and options, you can mouse-over the holding name to display a performance chart as well as the Last Price, % change, and Volume. Click on the name of the holding to go to the Stocks Overview page for that selected security.
You can change the Time Period for the data displayed. Select from: Today, 5 Days, 3 Months, 6 Months, 1 year, 3 Years, and 5 Years. The value in the % change column changes to display the % return for the selected time period. If you change the time period in the Gain/Loss table, this also changes the time period in the display of the Portfolio Change in the Portfolio Summary.
Click in any row of any holding to have that holding display in the detailed view section with a chart on the right side of the screen. Click the drop-down box under the chart to change the benchmark index that is displayed in the chart. The available indices are: TXS (default) DJIA, S&P 500, FTSE-100, CAC-40, Nikkei, and HangSeng.
Click Add a Transaction to open the Add a Transaction dialog box. See Adding a Transaction for more information.
Click Download this Portfolio in CSV Format to view this portfolio in an Excel spreadsheet.
Click Create Report to open a portfolio report in PDF format. The report contains overview information about the current value and change in value for each of your portfolios as well as aggregated values for all your portfolios.