ETFsOverview
Search Criteria
Filter search criteria using below inputs
Click on magnifying glass icon to search
| Company | Country | Symbol |
|---|

| Digital Assets | Equity Precious Metals | Financial | |
|---|---|---|---|
| 2024-10-31 | 65.79% | 47.19% | 45.08% |
| 2024-09-30 | 59.42% | 42.00% | 41.74% |
| 2024-08-31 | 51.01% | 34.43% | 41.29% |
| 2024-07-31 | 74.55% | 31.89% | 39.12% |
| 2024-06-30 | 68.23% | 21.47% | 28.11% |
| 2024-05-31 | 82.50% | 29.50% | 28.78% |
| 2024-04-30 | 58.34% | 20.30% | 24.05% |
| 2024-03-31 | 98.12% | 14.60% | 29.65% |
| 2024-02-29 | 75.57% | -3.41% | 23.54% |
| 2024-01-31 | 27.87% | 2.58% | 20.67% |
| 2023-12-31 | 39.05% | 12.73% | 20.59% |
| 2023-11-30 | 14.86% | 11.18% | 10.94% |
| 2023-10-31 | 0.00% | 0.00% | 0.00% |
ETF’s are designed to track certain indices, sectors, or sub-sectors. As a market sector gains momentum, so too will the ETF’s designed to track them. The returns for all ETF’s in each sector are ranked against other sectors to determine the best performing categories. Risk is represented by the 3 Year Standard Deviation.Select up to 3 categories to compare in the chart above.
| Top & Bottom Performing Categories | 1 Year Return sortable | Risk (3yr Avg) sortable |
|---|---|---|
+65.79% | 78.46 | |
+47.19% | 31.44 | |
+45.08% | 23.93 | |
+41.11% | 20.91 | |
+39.88% | 25.91 | |
-6.00% | 12.40 | |
+1.23% | 15.16 | |
+1.90% | 25.71 | |
+3.53% | 28.77 | |
+5.34% | 2.80 |
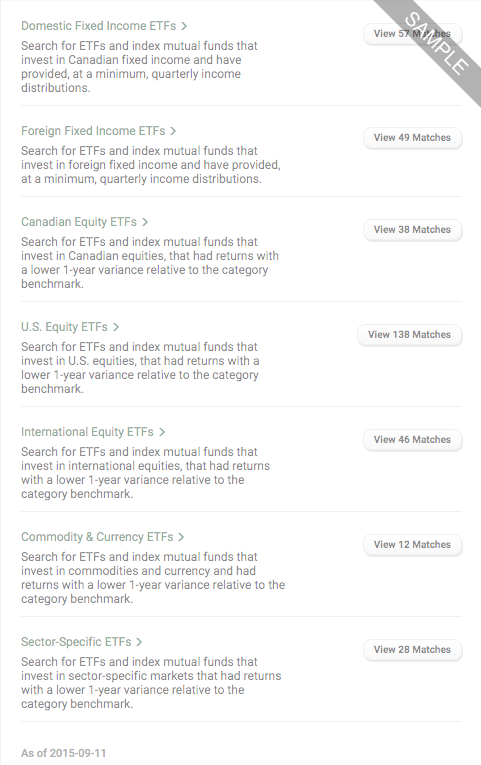
Through Featured Screens you can choose from a variety of predefined searches based on popular investing themes and ETF categories including domestic, global, sector-specific, and much more.
Open a New Account, or Login if you're a client.

The Fund Comparison Tool lets you compare up to 5 ETFs and/or mutual funds. Use the tool to quickly view and analyze fund details side-by-side, access historical performance charts, and compare performance to key market indices.
Open a New Account, or Login if you're a client.

Today's ETF Movers
| Name | Price | Change % |
|---|---|---|
21.57 | +22.84% | |
5.56 | +16.32% | |
23.15 | +13.09% | |
2x Ether ETFETHU | 8.35 | +13.00% |
39.59 | +12.09% | |
| Data delayed at least 15 minutes. | ||
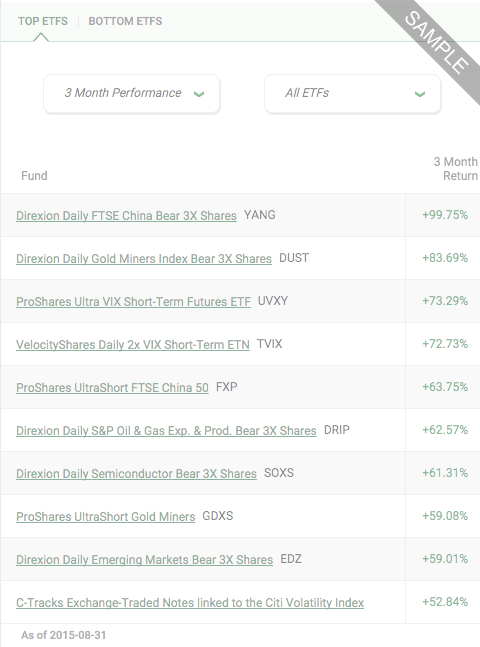
Access the top and bottom performing ETFs over a wide variety of time periods through the Performers feature.
Open a New Account, or Login if you're a client.

Identify potential investment opportunities with our convenient Quick Screen Tool. Screen for ETFs using popular criteria, or create your own detailed custom screens.
Open a New Account, or Login if you're a client.
