Silvercorp Metals IncTSX:SVMposition sur NYSE American
- Dernier cours $5,5800
- Variation du jour (%)0,3000 (5,6818%)
- Cours achet. / Lots5,5500/ 8
- Cours vend. / Lots5,6000/ 156
- Ouvert / Clôt. préc.5,4000 / 5,2800
- Fourchette du jour
- Fourchette de 52 sem.
- Volume1 282 923
Critères de recherche
Filtrez les critères de recherche à l’aide des options ci-dessous
Cliquez sur l’icône en forme de loupe pour faire une recherche
| Sociétés | Pays | Symbole |
|---|
- TSX Comp
- TSX Venture
- DJIA
- S&P 500
- NASDAQ

| Heure | Volume | SVM |
|---|---|---|
| 09:32 ET | 36000 | 5.4 |
| 09:34 ET | 3800 | 5.33 |
| 09:36 ET | 19600 | 5.3 |
| 09:38 ET | 13700 | 5.3 |
| 09:39 ET | 3700 | 5.26 |
| 09:41 ET | 3700 | 5.31 |
| 09:43 ET | 7200 | 5.33 |
| 09:45 ET | 9000 | 5.305 |
| 09:48 ET | 100 | 5.31 |
| 09:50 ET | 2600 | 5.36 |
| 09:52 ET | 7000 | 5.37 |
| 09:54 ET | 2000 | 5.38 |
| 09:56 ET | 600 | 5.39 |
| 09:57 ET | 27000 | 5.47 |
| 09:59 ET | 8600 | 5.47 |
| 10:01 ET | 30000 | 5.51 |
| 10:03 ET | 41100 | 5.59 |
| 10:06 ET | 20500 | 5.61 |
| 10:08 ET | 17600 | 5.58 |
| 10:10 ET | 23100 | 5.63 |
| 10:12 ET | 19500 | 5.71 |
| 10:14 ET | 13100 | 5.72 |
| 10:15 ET | 13500 | 5.72 |
| 10:17 ET | 12600 | 5.67 |
| 10:19 ET | 16400 | 5.65 |
| 10:21 ET | 30200 | 5.67 |
| 10:24 ET | 14500 | 5.665 |
| 10:26 ET | 7000 | 5.69 |
| 10:28 ET | 7800 | 5.71 |
| 10:30 ET | 12200 | 5.71 |
| 10:32 ET | 18000 | 5.72 |
| 10:33 ET | 1000 | 5.69 |
| 10:35 ET | 1200 | 5.72 |
| 10:37 ET | 13700 | 5.69 |
| 10:39 ET | 7800 | 5.7 |
| 10:42 ET | 6500 | 5.71 |
| 10:44 ET | 1800 | 5.69 |
| 10:46 ET | 2400 | 5.69 |
| 10:48 ET | 9700 | 5.71 |
| 10:50 ET | 7600 | 5.7 |
| 10:51 ET | 4900 | 5.72 |
| 10:53 ET | 13100 | 5.74 |
| 10:55 ET | 17600 | 5.71 |
| 10:57 ET | 4200 | 5.69 |
| 11:00 ET | 3900 | 5.69 |
| 11:02 ET | 7000 | 5.71 |
| 11:04 ET | 3400 | 5.7 |
| 11:06 ET | 9800 | 5.74 |
| 11:08 ET | 100 | 5.74 |
| 11:09 ET | 54900 | 5.79 |
| 11:11 ET | 1300 | 5.79 |
| 11:13 ET | 11600 | 5.79 |
| 11:15 ET | 2100 | 5.78 |
| 11:18 ET | 1600 | 5.76 |
| 11:20 ET | 500 | 5.73 |
| 11:22 ET | 4300 | 5.75 |
| 11:24 ET | 4200 | 5.76 |
| 11:26 ET | 30300 | 5.76 |
| 11:27 ET | 3000 | 5.73 |
| 11:29 ET | 20600 | 5.71 |
| 11:31 ET | 81000 | 5.72 |
| 11:33 ET | 2600 | 5.71 |
| 11:36 ET | 2200 | 5.67 |
| 11:38 ET | 300 | 5.67 |
| 11:40 ET | 2200 | 5.67 |
| 11:42 ET | 3400 | 5.68 |
| 11:44 ET | 5900 | 5.68 |
| 11:45 ET | 500 | 5.67 |
| 11:49 ET | 2100 | 5.65 |
| 11:51 ET | 23800 | 5.68 |
| 11:54 ET | 100 | 5.68 |
| 11:56 ET | 2100 | 5.66 |
| 11:58 ET | 3000 | 5.67 |
| 12:00 ET | 2700 | 5.67 |
| 12:02 ET | 7600 | 5.62 |
| 12:09 ET | 1300 | 5.63 |
| 12:12 ET | 1900 | 5.66 |
| 12:14 ET | 100 | 5.66 |
| 12:18 ET | 5600 | 5.67 |
| 12:20 ET | 6000 | 5.67 |
| 12:21 ET | 17600 | 5.67 |
| 12:25 ET | 4700 | 5.7 |
| 12:27 ET | 7000 | 5.73 |
| 12:30 ET | 6700 | 5.72 |
| 12:32 ET | 1000 | 5.71 |
| 12:36 ET | 1300 | 5.72 |
| 12:41 ET | 4700 | 5.7 |
| 12:45 ET | 2200 | 5.68 |
| 12:50 ET | 700 | 5.68 |
| 12:52 ET | 2000 | 5.69 |
| 12:54 ET | 100 | 5.68 |
| 12:56 ET | 4400 | 5.7 |
| 12:57 ET | 4100 | 5.7 |
| 12:59 ET | 2300 | 5.69 |
| 01:03 ET | 300 | 5.68 |
| 01:06 ET | 700 | 5.675 |
| 01:08 ET | 4100 | 5.67 |
| 01:12 ET | 300 | 5.66 |
| 01:19 ET | 300 | 5.665 |
| 01:21 ET | 3100 | 5.67 |
| 01:24 ET | 100 | 5.67 |
| 01:33 ET | 57300 | 5.66 |
| 01:35 ET | 11100 | 5.65 |
| 01:42 ET | 400 | 5.655 |
| 01:44 ET | 400 | 5.655 |
| 01:46 ET | 1000 | 5.655 |
| 01:48 ET | 900 | 5.66 |
| 01:50 ET | 200 | 5.66 |
| 01:51 ET | 300 | 5.66 |
| 01:53 ET | 700 | 5.655 |
| 01:55 ET | 700 | 5.655 |
| 01:57 ET | 1100 | 5.655 |
| 02:00 ET | 7100 | 5.67 |
| 02:02 ET | 2800 | 5.68 |
| 02:04 ET | 10500 | 5.69 |
| 02:06 ET | 3500 | 5.68 |
| 02:09 ET | 700 | 5.69 |
| 02:11 ET | 200 | 5.685 |
| 02:13 ET | 400 | 5.68 |
| 02:15 ET | 100 | 5.69 |
| 02:20 ET | 10800 | 5.66 |
| 02:22 ET | 500 | 5.66 |
| 02:24 ET | 6700 | 5.64 |
| 02:26 ET | 200 | 5.64 |
| 02:27 ET | 5200 | 5.61 |
| 02:29 ET | 100 | 5.61 |
| 02:31 ET | 200 | 5.61 |
| 02:36 ET | 300 | 5.61 |
| 02:42 ET | 600 | 5.605 |
| 02:44 ET | 3800 | 5.59 |
| 02:45 ET | 17400 | 5.56 |
| 02:47 ET | 2700 | 5.57 |
| 02:49 ET | 2000 | 5.58 |
| 02:51 ET | 2800 | 5.56 |
| 02:58 ET | 3600 | 5.56 |
| 03:00 ET | 4700 | 5.555 |
| 03:03 ET | 1300 | 5.56 |
| 03:05 ET | 8700 | 5.6 |
| 03:09 ET | 300 | 5.6 |
| 03:12 ET | 2500 | 5.61 |
| 03:14 ET | 20700 | 5.62 |
| 03:16 ET | 3900 | 5.62 |
| 03:18 ET | 300 | 5.63 |
| 03:20 ET | 4200 | 5.63 |
| 03:23 ET | 100 | 5.64 |
| 03:25 ET | 600 | 5.64 |
| 03:27 ET | 300 | 5.64 |
| 03:30 ET | 3800 | 5.64 |
| 03:32 ET | 14000 | 5.59 |
| 03:34 ET | 2000 | 5.57 |
| 03:36 ET | 500 | 5.57 |
| 03:38 ET | 9000 | 5.59 |
| 03:39 ET | 1300 | 5.59 |
| 03:41 ET | 1300 | 5.59 |
| 03:43 ET | 15400 | 5.58 |
| 03:45 ET | 3800 | 5.58 |
| 03:48 ET | 800 | 5.58 |
| 03:50 ET | 1400 | 5.57 |
| 03:52 ET | 1400 | 5.57 |
| 03:54 ET | 900 | 5.575 |
| 03:56 ET | 29500 | 5.59 |
| 03:57 ET | 5800 | 5.59 |
| 03:59 ET | 36200 | 5.58 |
mai 23, 2024
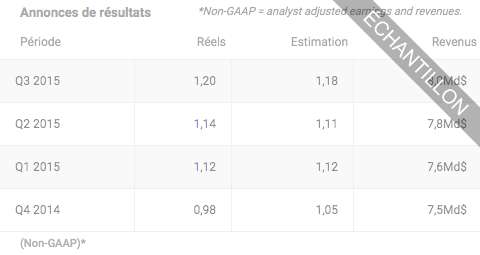
Press Release: SILVERCORP REPORTS ADJUSTED NET INCOME OF $39.3 MILLION, $0.22 PER SHARE, AND CASH FLOW FROM OPERATIONS OF $91.6 MILLION FOR FISCAL 2024, from le jeudi 23 mai 2024 à 5 h 12 PM HE par Dow Jones
le jeudi 23 mai 2024 à 5 h 12 PM HE par Dow JonesPress Release: SILVERCORP REPORTS ADJUSTED NET INCOME OF $39.3 MILLION, $0.22 PER SHARE, AND CASH FLOW FROM OPERATIONS OF $91.6 MILLION FOR FISCAL 2024, from le jeudi 23 mai 2024 à 5 h 12 PM HE par Dow Jones
le jeudi 23 mai 2024 à 5 h 12 PM HE par Dow JonesSILVERCORP REPORTS ADJUSTED NET INCOME OF $39.3 MILLION, $0.22 PER SHARE, AND CASH FLOW FROM OPERATIONS OF $91.6 MILLION FOR FISCAL 2024, from le jeudi 23 mai 2024 à 5 h 12 PM HE par Dow Jones
le jeudi 23 mai 2024 à 5 h 12 PM HE par Dow Jones
avril 26, 2024
DJ Silvercorp Metals to Acquire Adventus Mining in C$200M Transaction, from le vendredi 26 avril 2024 à 6 h 23 AM HE par Dow Jones
le vendredi 26 avril 2024 à 6 h 23 AM HE par Dow JonesPress Release: SILVERCORP TO ACQUIRE ADVENTUS, CREATING A GEOGRAPHICALLY DIVERSIFIED MINING COMPANY BY ADDING THE ADVANCED EL DOMO PROJECT, from le vendredi 26 avril 2024 à 5 h 35 AM HE par Dow Jones
le vendredi 26 avril 2024 à 5 h 35 AM HE par Dow Jones
| Sociétés sortable | Capitalisation boursière sortable | Ratio C/B (12DM) sortable | Croiss. BPA (5 ans) sortable |
|---|---|---|---|
Silvercorp Metals Inc | 986,2Mn | 20,2x | -2,76% |
Endeavour Silver Corp | 1,2Md | -460,2x | --- |
Karora Resources Inc | 945,7Mn | 68,5x | --- |
Wesdome Gold Mines Ltd | 1,6Md | -261,0x | --- |
Victoria Gold Corp | 516,8Mn | 33,8x | --- |
K92 Mining Inc | 1,8Md | 42,8x | -7,39% |
Profil de la Société
Silvercorp Metals Inc. is a mining company. The Company is engaged in producing silver, gold, lead, and zinc with a long history of profitability and growth potential. It is engaged in the acquisition, exploration, development, and mining of mineral properties. The Company’s operations include Ying Mining District, GC Mine and BYP Mine. Its Ying operation is located approximately 240 kilometers (km) west-southwest of Zhengzhou, the capital city of Henan Province, China, and 145 km southwest of Luoyang. The flagship Ying operations consist of seven underground mines, including SGX, HZG, HPG, TLP, LME, LMW and DCG and two processing plants (combined 2,600 tpd capacity) The GC mine is located approximately 200 km west of Guangzhou, the capital city of Guangdong Province, China. The BYP Mine is located approximately 220 km southwest of Changsha, the capital city of Hunan Province, China. It also operates two sulphide flotation plants at Ying with a total design capacity of 2,600 tpd.
Coordonnées
- Siège social
- Suite 1750, 1066 W. Hastings StreetVANCOUVER, BC, Canada V6E 3X1
- Téléphone
- 604-669-9397
- Télécopieur
- 604-669-9387
Executives
- Chairman of the Board, Chief Executive Officer
- Rui Feng
- Chief Financial Officer
- Derek Liu
- Vice President
- Lon Shaver
- General Manager of China Operations
- Lichang Peng
- Deputy General Manager of China Operations
- Song Hong
Notre outil Cotes offre des cotes de recherche propres à une entreprise provenant de fournisseurs comme First Call, S&P et Argus.
ouvrez un nouveau compte ou ouvrez une session si vous êtes un client.
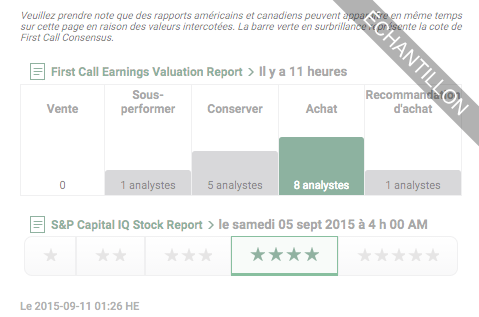
Vous avez accès à une gamme complète de rapports de recherche indépendants provenant de fournisseurs comme Valeurs Mobilières TD, S&P, INK et Argus.
ouvrez un nouveau compte ou ouvrez une session si vous êtes un client.
Capitalisation boursière | 986,2Mn$ |
|---|---|
Revenue (TTM) | 294,0Mn$ |
Actions en circulation | 177,6Mn |
Rendement de l'action | 0,61% |
Taux annuel des dividendes | 0,0250 USD |
Date ex-dividende | 11-23-23 |
Date de versement | 12-15-23 |
Bêta | 1,05 |
BPA (12 mois) | 0,28$ |
Valeur comptable | 3,91$ |
Ratio C/B | 20,2x |
Cours/Ventes (FYR) | 3,4 |
Cours/Flux de trésorerie (TTM) | 9,2x |
Marge d'exploitation | 29,70% |
Notre Calendrier vous permet de consulter une vaste sélection d'événements sur le marché et sur les entreprises, notamment les bénéfices, les dividendes, les fractionnements, les variations de cote, les prévisions de bénéfices et plus encore. Accédez aux événements passés, présents et futurs dans CourtierWeb.
ouvrez un nouveau compte ou ouvrez une session si vous êtes un client.